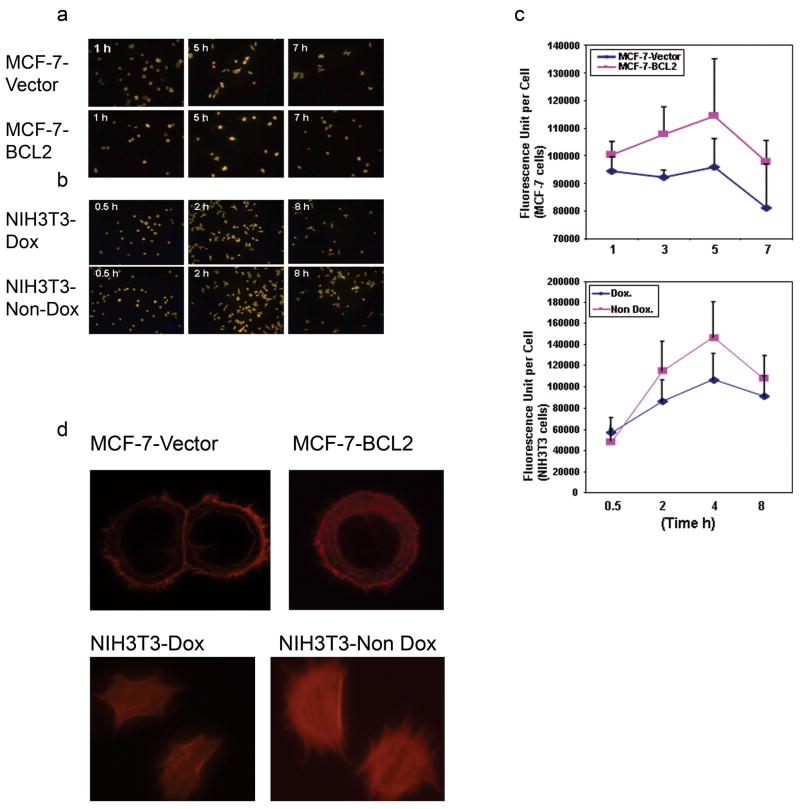
Fig. 3. BCL2 expression enhanced F-actin polymerization during cell spreading in vivo.
Cultured cells were fixed and and then stained with 165 nM Rhodamine phalloidin in PBS for 20 min. Five images were taken and the intensity of fluorescence was analyzed using a Zeiss LSM Imager. At least 500 randomly selected cells per data point were measureded to determine an average fluorescence value. The experiments were repeated twice with similar results. (a). In vivo F-actin staining of MCF-7 cells showed that F-actin increased during cell spreading, peaked at 5 hour and was reduced thereafter. (b). In vivo F-actin staining of NIH3T3 cells shows that F-actin increased during cell spreading, peaked at 4 hour and was reduced thereafter. (c). Quantitative fluorescence analysis showed that the average value per cell was higher in MCF-7 cells that overexpressed BCL2 (upper panel, at 1, 3, 5, 7 hour time points, P<0.01) and NIH3T3 cells (lower panel, at 0.5 hour time point, P = 0.48; at 2, 4, 8 hour time points, P<0.01). These results indicated that BCL2 expression significantly increased F-actin polymerization. (d). Representative F-actin staining of individual cell indicated that MCF-7-BCL2 cells have more extensive F-actin staining in the cytoplasma than do MCF-7-Vector cells (up panels). Representative F-actin staining of individual cells indicated that NIH3T3-Non Dox (right lower panel) have more extensive F-actin staining in the cytoplasm than do NIH3T3-Dox cells (left lower panel)

