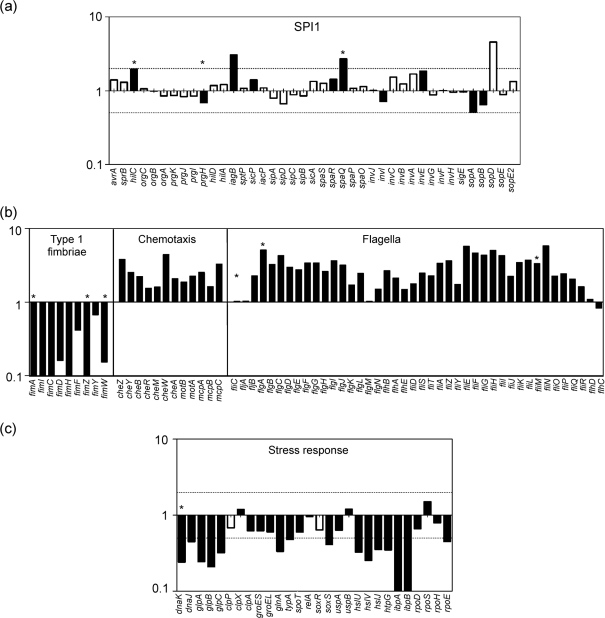
Fig. 2.
Relative expression levels of selected genes in S. Typhimurium. A value of 1 indicates no detectable difference in expression between aer-LL and μaer-ST bacteria, values >1 indicate higher expression in aer-LL bacteria and values <1 indicate higher expression in μaer-ST bacteria. Dotted lines indicate the twofold threshold. (a) SPI1 regulon genes. (b) Motility-associated genes. (c) Stress-related genes. Black bars denote data that passed the P-value threshold. Asterisks indicate data confirmed by qPCR.

