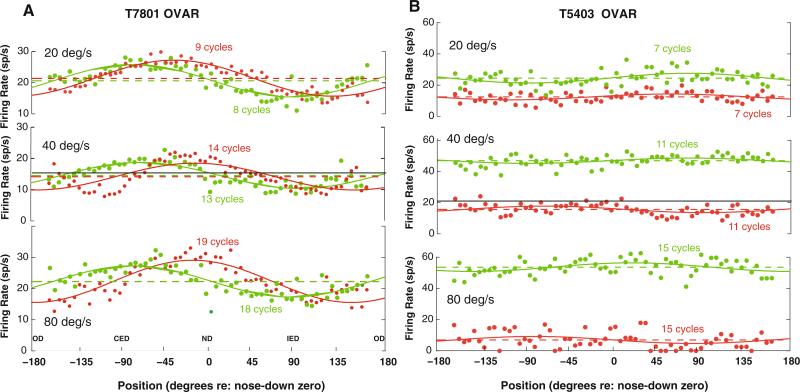
Fig. 2.
Two additional examples of the discharge rates of PBN units during constant velocity OVAR stimulation. The green trace shows responses during rotation toward the recorded side (ipsilateral rotation), while the red trace shows responses during rotation in the contralateral direction. The data are averaged across a window spanning one cycle of rotation. The head orientation relative to gravity is labeled in radians relative to nose down (ND) as zero and occiput down (OD) as ±180°. The ipsilateral ear down (IED) and contralateral ear down (CED) orientations are also labeled. The constant speed of OVAR is listed for each pair of traces. The points indicate the average instantaneous spike rate and the solid line indicates the best least-squares fit of a constant baseline plus cosine modulation model to the data (see text). The dashed line shows the baseline level for each unit in each stimulus condition, and the solid black line shows the background mean discharge rate. a The behavior of a PBN unit from another monkey with a small modulation response component and a baseline response component that did not change across OVAR stimulus velocities. b An example of a PBN unit with no significant modulation response during OVAR, but with a baseline component that varies with both the velocity and the direction of rotation

