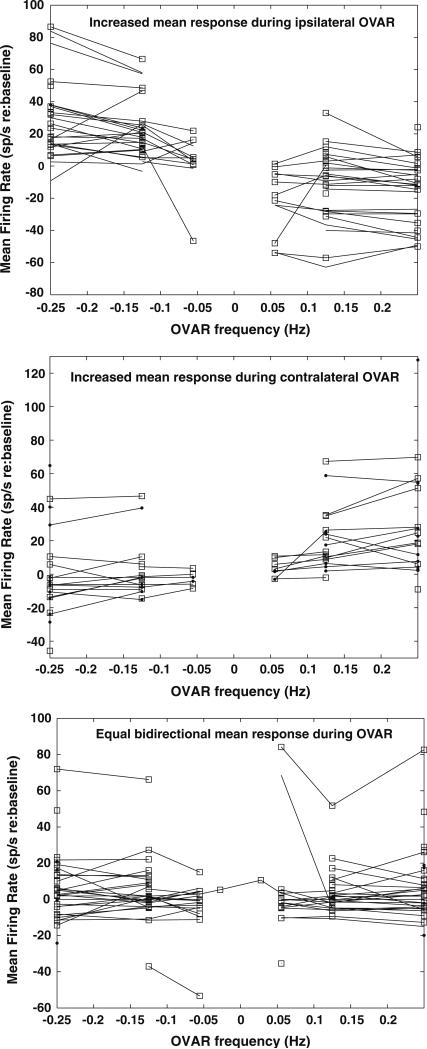
Fig. 3.
Mean firing rate patterns of PBN neurons during OVAR relative to baseline discharges. The baseline firing rate at rest was subtracted from the mean value of the response during OVAR. The upper panel shows the mean firing rates of units that showed an increasing mean discharge rate during ipsilaterally directed constant velocity OVAR and a decreasing rate during contralaterally directed OVAR. The middle panel shows the mean firing rates of units that showed a decreasing mean discharge rate during ipsilaterally directed constant velocity OVAR and an increasing rate during contralaterally directed OVAR. The lower panel shows the mean firing rates of units that showed an equal mean discharge rate during OVAR directed both ipsilaterally and contralaterally

