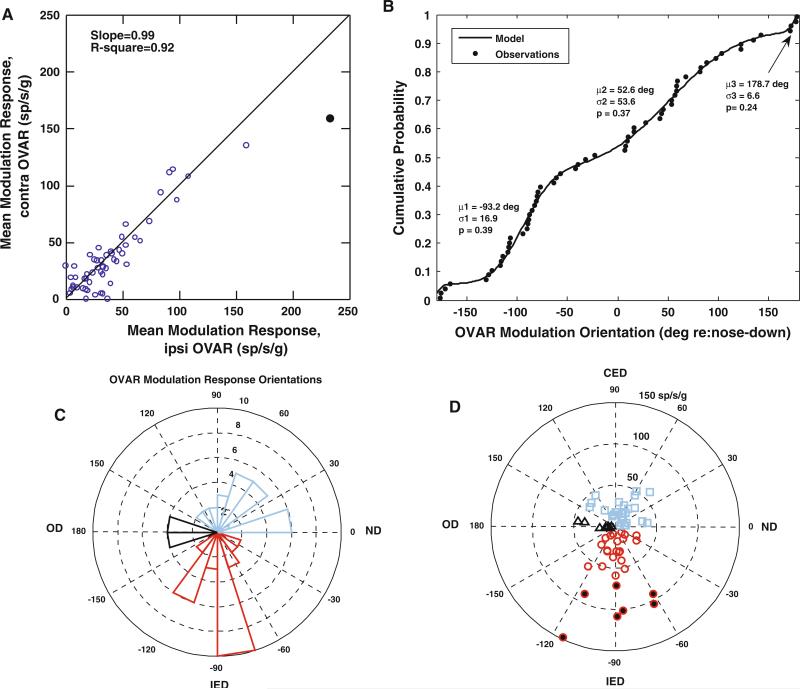
Fig. 5.
OVAR modulation response properties of PBN units. a A scatter plot of the relationship between the mean modulation response gains of individual units during ipsilaterally- (ipsi) and contralaterally- (contra) directed constant velocity OVAR. The responses tend to be equal in both directions; a linear relationship with a slope of 0.99 (model with no constant term) accounts for 92% of the variance. b The empirical cumulative distribution function of the orientations of the OVAR modulation responses of the PBN units in the sample. The line shows a model fit for a mixture of three wrapped normal distributions (means μ1, μ2, and μ3; standard deviations σ1, σ2, and σ3; proportions of observations p1, p2, and p3). The details of the least-squared estimation procedure, based on an order statistics approach, are described in the text. c A polar histogram of orientations of the units and d a polar coordinate plot of the depth of modulation as a function of the best mean response orientation of the unit. By convention, 0° represents the nose down, 90° the contralateral ear down, –90° the ipsilateral ear down, and 180° the occiput down orientations. The units with peak modulation responses in the ipsilateral ear down orientation are shown in cyan bars in c and cyan squares in d. Units with peak modulation responses in the contralateral ear down orientation are designated by red bars in c and red circles in d, with circles filled in black indicating high sensitivity units. Finally, units with peak modulation responses in the occiput down orientation are shown by black bars in c and black triangles in d

