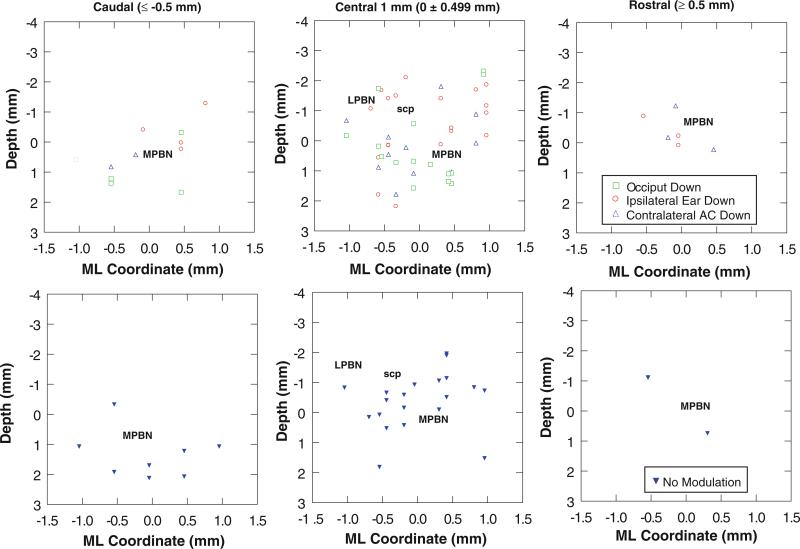
Fig. 7.
The distribution of PBN units is charted as a function of OVAR modulation response orientation for the caudal PBN (more than 0.5 mm caudal to the center of the responsive region), central 1 mm of PBN, and rostral PBN (more than 0.5 mm rostral to the center of the responsive region). The location of the medial region of the PBN (MPBN medial and external medial subnuclei), lateral region of the PBN (LPBN external and lateral subnuclei), and the superior cerebellar peduncle (scp) are indicated. The upper row illustrates the distribution of units with a significant OVAR modulation response. The lower row shows the distribution of units with no significant OVAR modulation

