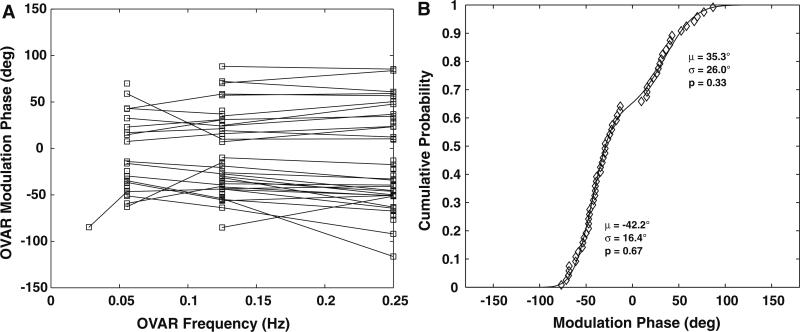
Fig. 8.
The phase of OVAR modulation response of PBN units is plotted as a function of frequency of revolution in a. Individual units showed either a phase-leading or phase-lagging pattern that did not change across the frequencies tested. b The empirical cumulative distribution function of the mean phase responses of these units. The line shows a model fit for a mixture of two wrapped normal distributions with respective means (μ), standard deviations (σ), and proportions of observations (p), confirming the consistency of the data with two different response phase populations

