
Figure 5. EZH2-modulation alters colony growth of some, but not all prostate cancer cell lines.
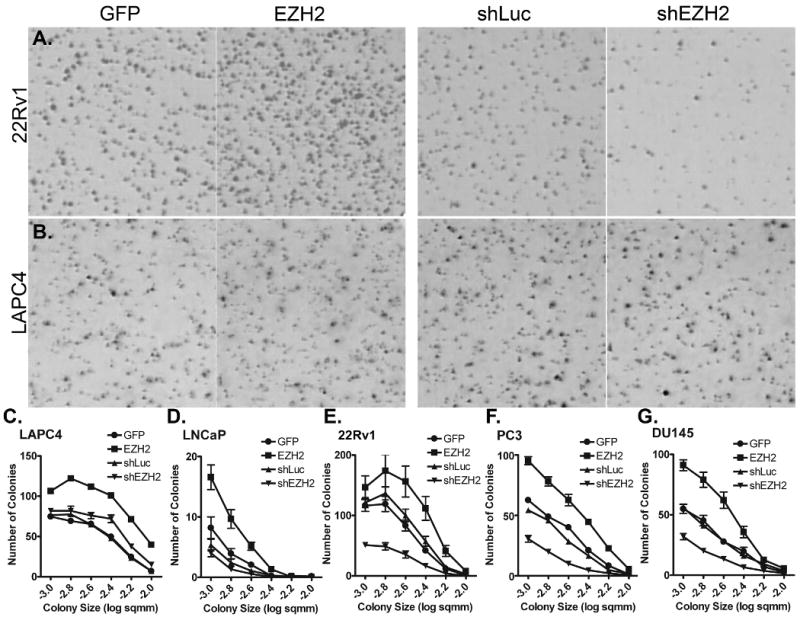
All cells were assayed at 14 days for ability to grow three-dimensional colonies in the presence of contact inhibition. Colonies were stained with 0.1% INT-Violet overnight prior to imaging. A. 22Rv1 and B. LAPC4 colonies are shown. For all panels, GFP: cells infected with the GFP control lentivirus; EZH2: cells infected with the EZH2-overexpession lentivirus; shLuc: Cells infected with a control shRNA lentivirus; shEZH2: cells infected with shEZH2 lentivirus. Quantification of colony growth in C. LAPC4, D. LNCaP, E. 22Rv1, F. PC3, and G. DU145. Colony growth is represented as number of colonies versus colony size. Quantifications are shown in Table II.