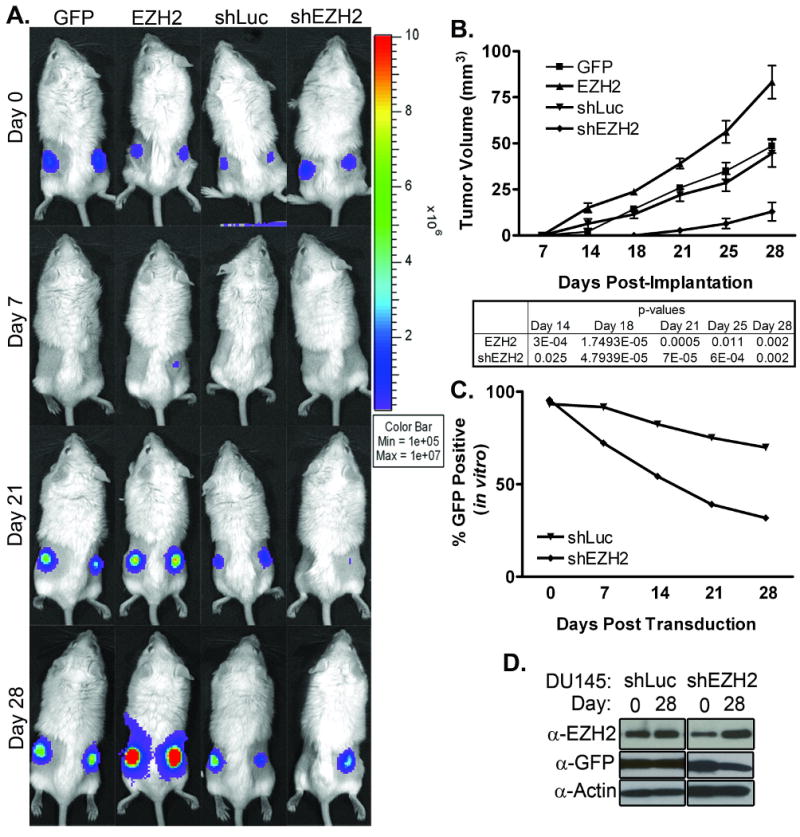
Figure 6. EZH2 overexpression and knockdown phenotypes extend to in vivo tumor growth.

A. SCID mice implanted bilaterally with DU145 cells were imaged for optical signal over the course of tumor growth. Representative mouse from each group is shown. B. Physical tumor volumes based on measurements of largest and smallest diameters. Average of each group is shown. n=10. P-values calculated using two-tailed T-Test. C. In vitro cultured shEZH2- and shLuc-transduced DU145 cells were monitored periodically for GFP expression by Flow analysis to assess changes in the populations. D. In vitro cultured shEZH2- and shLuc-transduced DU145 cells were assayed by western blot for EZH2 and GFP expression over time. Time points shown are Day 0 and Day 28 post transduction. α-EZH2: antibody specific for exogenous and endogenous EZH2; α-GFP: antibody specific for EGFP; and α-Actin: antibody specific for β-Actin, used as a loading control. For all panels, GFP: Cells infected with GFP Control lentivirus; EZH2: Cells infected with EZH2-overexpession lentivirus; shLuc: Cells infected with control shRNA lentivirus; shEZH2: Cells infected with shEZH2 lentivirus.
