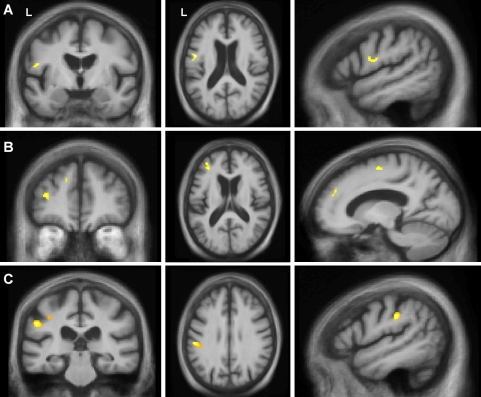
Fig. 2.
VBM analysis correlating grey matter loss with diadochokinetic rate (apraxia of speech) score (a), orofacial apraxia score (b) and limb apraxia score (c). Statistical parametric maps (SPMs) have been thresholded at p < 0.001 (uncorrected) and rendered on coronal (left), axial (middle) and sagittal (right) sections of a study-specific average group T1-weighted MRI template image in DARTEL space. In coronal and axial sections, the left hemisphere (L) is shown on the left side of the image as indicated. All sagittal sections are through the left hemisphere

