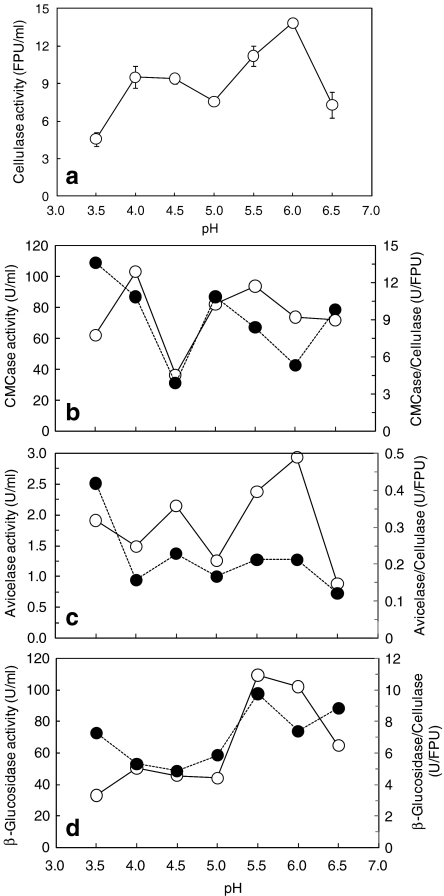
Fig. 3.
pH response of cellulase activity (a), CMCase and its ratio to cellulase (b), avicelase and its ratio to cellulase (c), and β-glucosidase and its ratio to cellulase (d). The enzyme activity (straight lines) and the ratio of each enzyme to cellulase (dotted lines) were analyzed at the end of each pH-controlled culture

