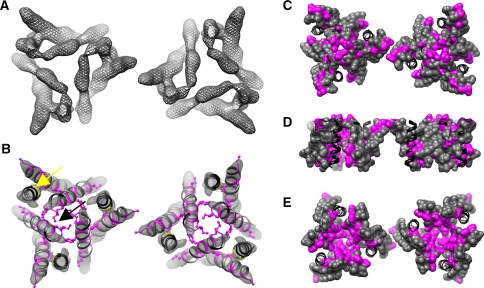
Fig. 3.
Visualization of Trp-mutation phenotypes in the context of the hCTR1 3D structure. Straight α-helical segments were modified to create a pdb of hCTR1 helices that fit into the EM map of hCTR1 (see “Experimental Procedures” section for more detail) to help visualize the Trp-mutation phenotypes obtained in this study. a The electron density (gray mesh) of two hCTR1 trimers making 2D crystal lattice contacts (~3σ). b The pdb of the helices representing hCTR1 (shown as ribbons) after fitting into the 3D hCTR1 density map (gray surface, ~3.5σ). Positions that were tested in this study and where introduction of Trp had no phenotypic effect are colored gray. Positions where introduction of Trp caused a phenotype are colored magenta, with side chains shown (b). Positions that were either not tested or part of our previous study are labeled in black. The position of the GlyxxxGly motif in TM3 is indicated by a yellow arrow. Black arrow points to the Met residues of the MetxxxMet motif on TM2. c–e Different surface views of the trimer model: c looking down through the pore from the extracellular side, d a side view and e a view looking up through the pore from the intracellular side. The coloring scheme is the same in b except mutated residues are displayed by surface representation and all else are kept in ribbon

