Figure 3.
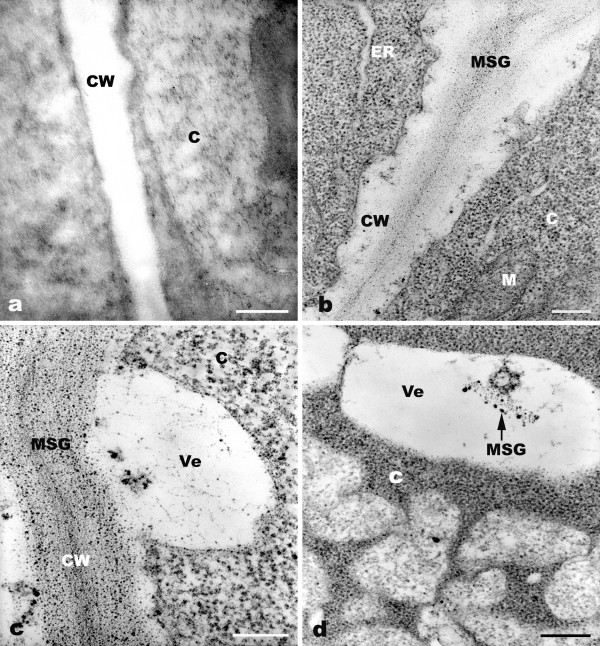
TEM micrographs showing cytochemical test of the root meristematic cells of A. sativum exposed to 10-4 M Pb. a: No Gomori-Swift reaction in control cells. b: Trace amounts of silver grains in the cell walls of root cells exposed to Pb for 2 h. c: Increased amount of metallic silver grains in cell walls after treatment for 4 h. d: Rich metallic silver grains in cytoplasm and vesicles (arrow; 24 h). C = cytoplasm, CW = cell wall, ER = endoplasmic reticulum, M = mitochondria, MSG = metallic silver grains, Ve = vesicle. Bar = 0.25 μm.

