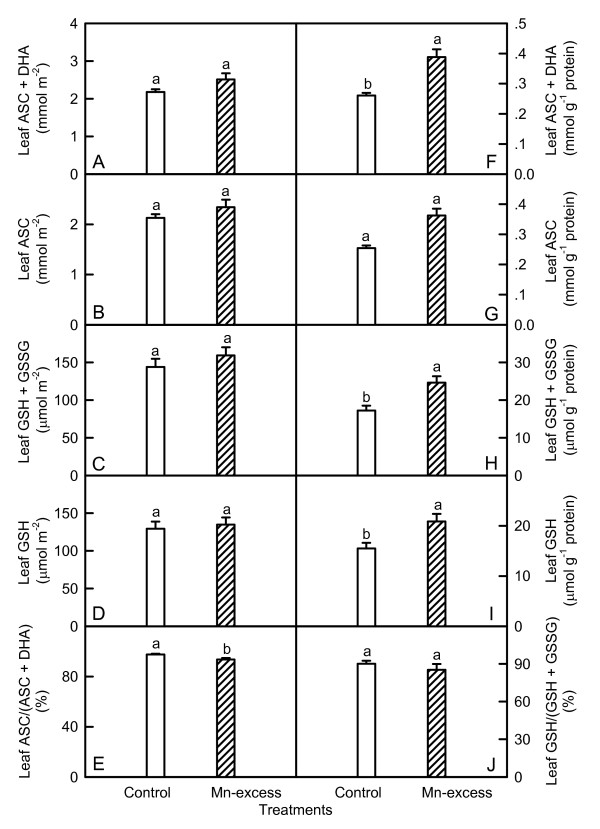
Figure 7.
Effects of Mn-excess on contents of ASC + DHA (A and F), ASC (B and G), GSH + GSSG (C and H), GSH (D and I) expressed on a leaf area (A-D) or protein (F-I) basis, and ratios of ASC to ASC + DHA (E) and GSH to GSH + GSSG (J) in sour pummelo leaves. Bars represent means ± standard errors (n = 5-8). Different letters above standard error bars indicate significant differences at P < 0.05.

