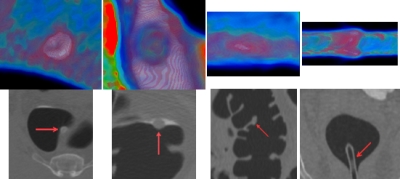
Figure 14.
Color projection images (first row) of four IPCs, where each column represents one IPC. The second row shows the IPCs (indicated by the arrows) from zoomed CTC axial∕sagittal slices. Columns 1 and 2 are two stool. One is a tagged adherent stool on a fold, another is partly submerged in the fluid and is less tagged. Column 3 is a thickened fold without any tagged material nearby and column 4 is a tube in another scan.

