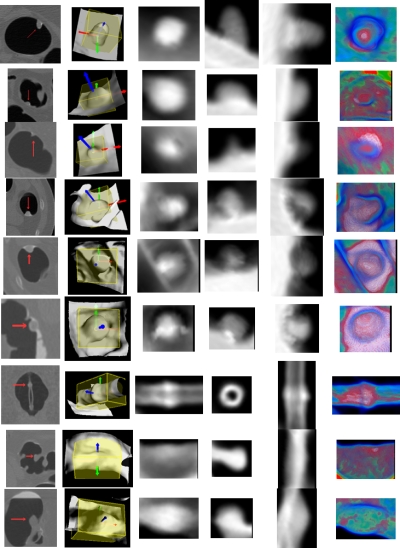
Figure 9.
Illustration of the projected gray and color images of several IPCs (including FP and TP findings), where each row represents one IPC. Column 1 shows parts of the original axial, coronal, or sagittal CTC slices with the arrow indicating the IPCs. The sub-volumes and LRFs are shown in column 2. Columns 3 to 5 show the corresponding gray images (the axial, sagittal, and coronal images) of the IPCs. The last column shows the axial color image generated by Eq. 3. True polyps in rows 1 to 3 are 10 (same as in Fig. 2), 9, and 6 mm, respectively. FPs in rows 4 to 6 are three tagged stool, while rows from 7 to 9 are a tube, a thickened fold, and a round ileocecal valve.

