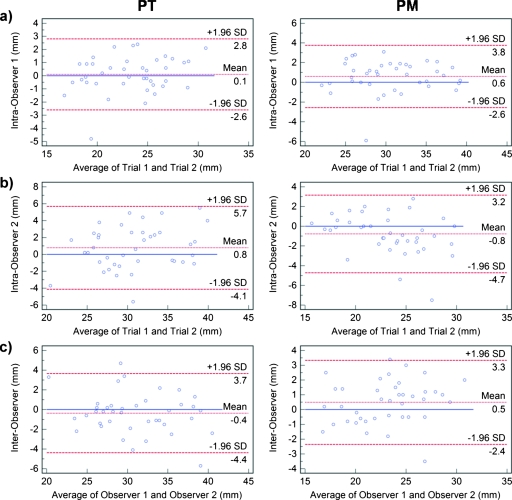
Figure 4.
Bland–Altman plots comparing intraobserver for (a) observer 1 and (b) observer 2, and (c) interobserver variability in measuring the pulmonary trunk (left) and pulmonary main (right). In each plot, the differences (in mm) are plotted against average measurements (in mm) of the corresponding two methods. Dashed lines represent the mean difference of the two methods, and the 95% limits of agreement (±1.96 SD). The solid line is the zero baseline.

