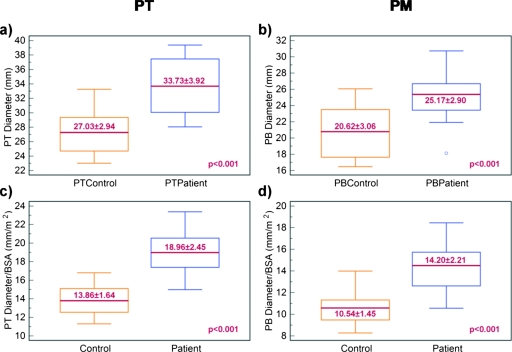
Figure 7.
Box plots for control vs patient data. (a) The maximum diameter of the pulmonary trunk was significantly larger in the patient population compared to controls. (b) The largest diameter of the pulmonary main vessels was significantly larger in the patient population compared to controls. A significant separation between patients and controls was also remarked after normalization to BSA for both (c) PT and (d) PM.

