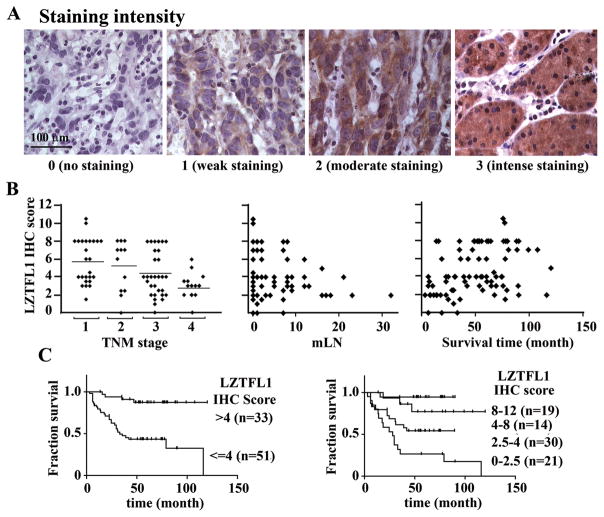
Figure 2.
(A) Representative micrographs showing typical examples of the four intensity grades of LZTFL1staining in tumor samples of the cohort of 84 gastric cancer patients. (B) Correlations between LZTFL1 IHC score and TNM stage (left panel, Pearson r=−0.4117, p=0.0001, two-tailed. bar, average IHC score for each individual TNM stage), number of mLN (middle panel, Pearson r=−0.3229, p=0.0027, two-tailed; not all the data points are in view since the majority of the patients have mLN less than 10), and survival times (right panel, Pearson r=0.3805, p=0.0004, two-tailed) in the cohort of patients in this study. (C) Kaplan-Meier survival curves according to LZTFL1 IHC scores for negligible and weak (IHC score <=4) versus moderate and strong expression (IHC scores >4) (left panel, p=0.0002, log-rang test), and the individual stratified IHC scores (right panel, p=0.0002, log-rank test). n, number of patients.

