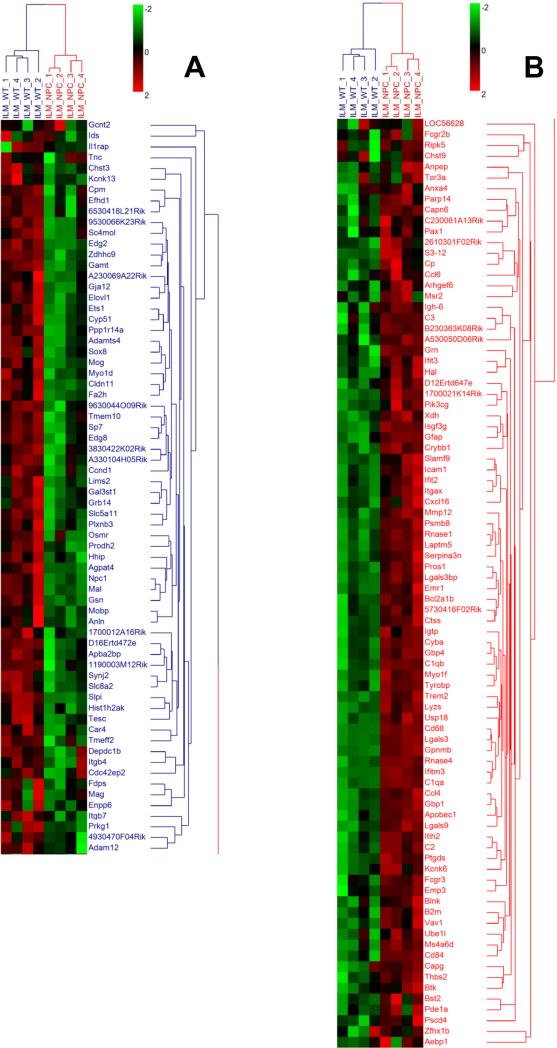
Figure 2. Hierarchical clustering of differentially expressed genes.
Gene clustering was based on the Z-scores obtained in the expression profiles of the 154 DEGs in Npc1-/- (NPC) and Npc1+/+ (WT) mice. In the color-coded map, a red color indicates a higher than average expression and a green color a lower than average expression across all 8 mice. A: genes down-regulated in Npc1-/- (NPC) mice; B: genes up-regulated in Npc1-/- (NPC) mice. See Methods section for details.

