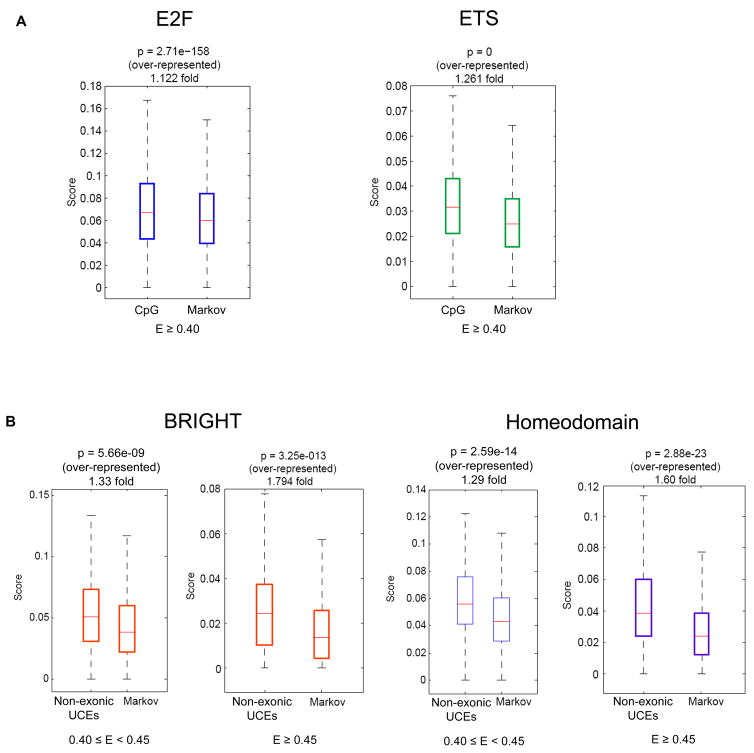
Figure 1. Enrichment of particular TFs’ 8-mers within putative regulatory regions.
(A) CpG islands are enriched for PBM ‘bound’ 8-mers for E2F and ETS proteins. Results for 8-mers bound at E ≥ 0.43 or E ≥ 0.45 are shown in Supplementary Figure S2. (B) ‘Moderate’ (0.40 ≤ E < 0.45) and ‘high’ (E ≥ 0.45) affinity 8-mers of TFs in the BRIGHT and homeodomain classes are enriched within non-exonic UCEs as compared to shuffled sequences generated to have the same dinucleotide content. In both panels, “score” and P-values are as described in Supplementary Figure 1.

