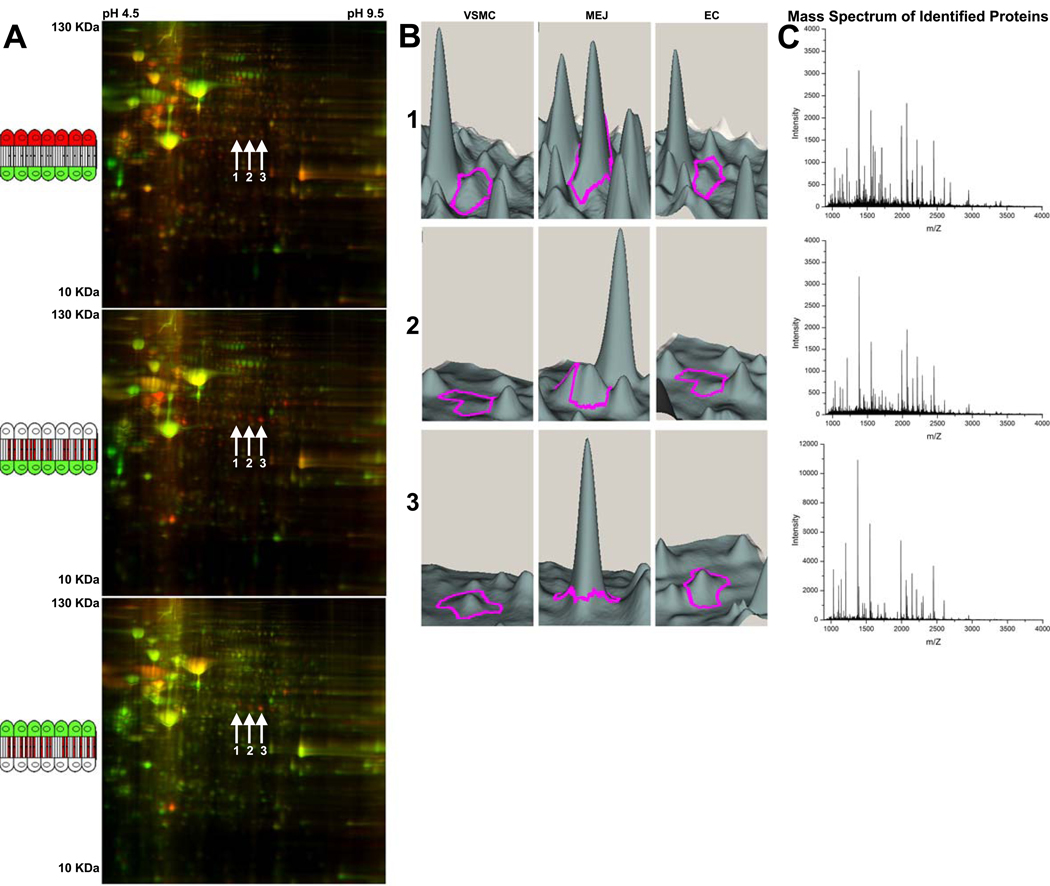
Figure 2. 2D-DIGE analysis of isolated MEJ protein fractions from vascular cell co-culture.
2D-DIGE blots of isolated protein fractions from the VCCC. Cartoon schematics in A represent the compared fractions for each gel image as they occur in the VCCC. Conditions include comparison of EC (red) to VSMC (green), (A, top); MEJ (red) to VSMC (green), (A, middle); and MEJ (red) to EC (green), (A, bottom). Arrows labeled 1–3 in A indicate three spots representing a unique protein with greater than 2.5 fold increase in fluorescent intensity (i.e., protein expression) in the MEJ versus VSMC and EC fractions. Using Quantitative DeCyder analysis, spots 1–3 are represented in a 3D visualization for each spot of interest and identified by a magenta tracer (Fig 2B), indicating protein fluorescent intensity peaks in VSMC, MEJ and EC fractions. The mass spectrum of spots 1 (C, top), 2 (C, middle) and 3 (C, bottom) identified each spot as plasminogen activator inhibitor-1. For all images, n=30 Tranwells.

