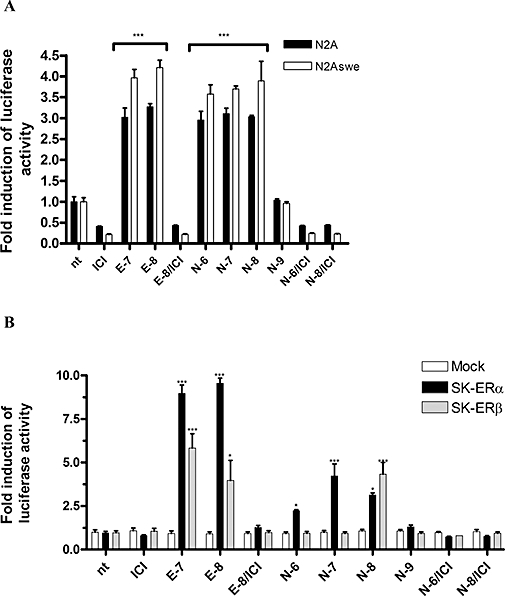
Figure 2.

ER reporter assay with N2A and N2Aswe (A) and ER stable transfected SK-N-MC cells (B). Activation of the ER response element was plotted as fold induction of luciferase activity normalized to untreated cells (n.t.). Treatment: n.t., untreated; ICI, ICI 182780 at final concentration (f.c) of 10−6 M; E-7, E2 f.c. 10−7 M; E-8, oestrogen f.c. 10−8 M, N-6, nebivolol f.c. 10−6 M. The results shown represent more than three independent studies. Significance is defined as follows: *P < 0.05; ***P < 0.001 compared with untreated cells (anova).
