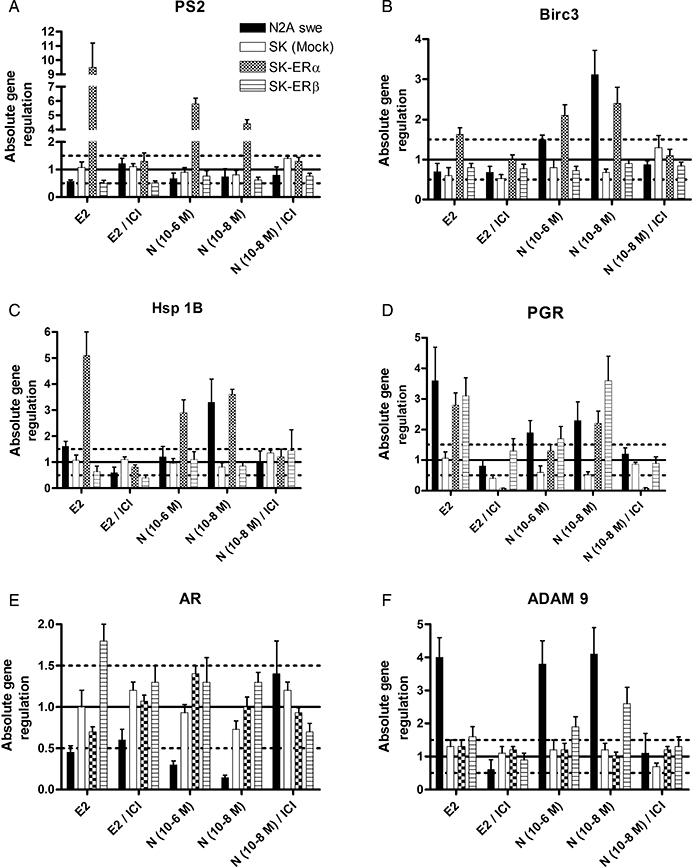
Figure 4.

Relative mRNA expression ratios of E2 and nebivolol-regulated genes in N2Aswe and SK-N-MC ERα and ERβ over-expressing cells. Cells were treated with E2 (f.c. 10−8 M), nebivolol (10−6 M and 10−8M) and oestrogen and nebivolol (10−8M) together with ICI 182780 for 18 h. Genes were considered differentially expressed when the expression levels between untreated and treated cells (expressed as a ratio) were more than 1.5-fold difference (dotted lines) and a P value <0.05. Fold change of gene expression levels was based on the ΔΔCt method with normalization of the raw data to housekeeping genes by using the relative expression software tool (REST-MCS V2.0).
