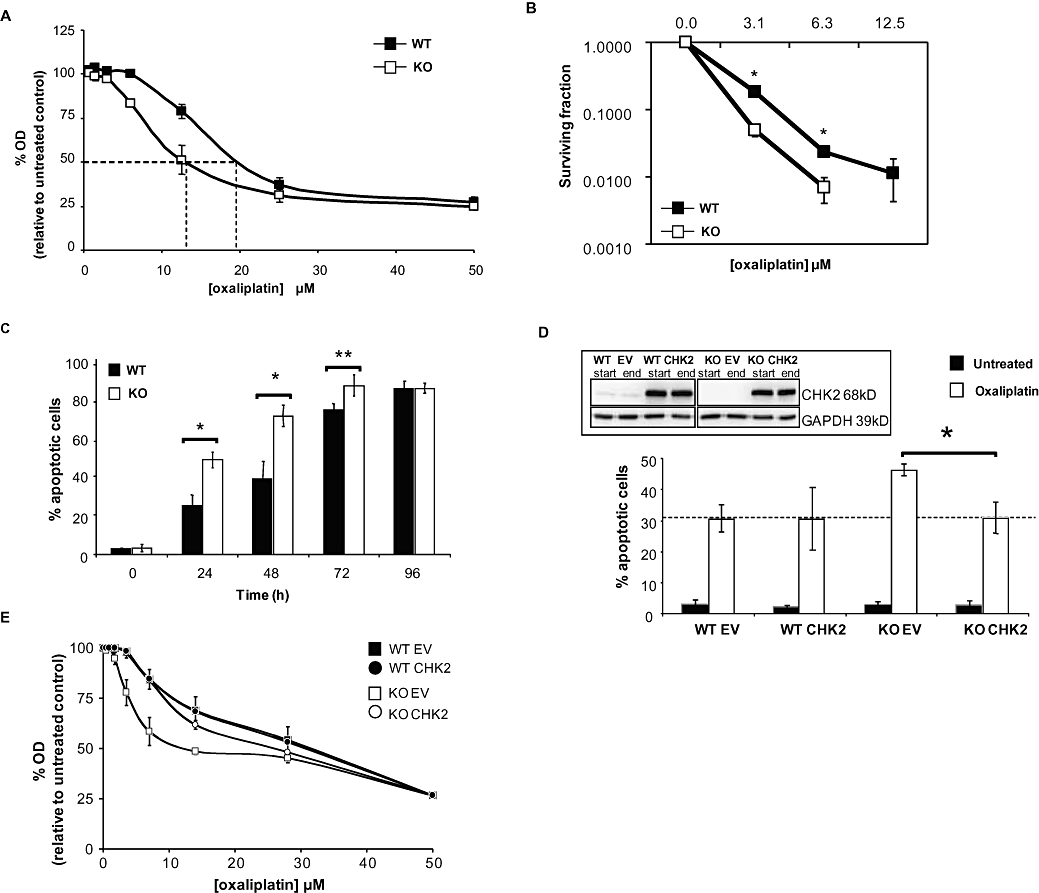
Figure 1.

Characterization of the effect of oxaliplatin on HCT116 checkpoint kinase 2 (CHK2) wild-type (WT) and KO cell lines. Responses of HCT116 CHK2 WT and CHK2 KO to treatment with oxaliplatin for 1 h. (A) Sulforhodamine-B (SRB) concentration–response curves, dashed lines indicate the IC50 doses. (B) Clonogenic survival curves. (C) Oxaliplatin-induced apoptosis kinetics for the CHK2 WT and CHK2 KO following 40 µM continuous treatment with oxaliplatin. Data represent the percentage of apoptotic cells based on DAPI (4′-6′-diamino-2-phenylindole di-hydrochloride) stained nuclear morphology (condensation and fragmentation). (D) CHK2 WT or CHK KO cells were transfected with either empty vector (EV) or CHK2-expressing vector (CHK2) then exposed continuously to 40 µM oxaliplatin or to vehicle control for 24 h. The percentages of apoptotic cells were determined as in (C). The data represented in (A–D) are the average of three independent experiments, ±SE. *P < 0.05 and **P < 0.01, Student's t-test. Inset: western blot, representative of three independent experiments, showing expression of CHK2 in cell lines following transfection, just prior to oxaliplatin treatment (start) and 24 h following (end) of treatment. GAPDH was used as a loading control. (E) SRB concentration–response curves of HCT116 CHK2 WT and CHK2 KO transfected with either an EV or CHK2-expressing vector (CHK2) following treatment with oxaliplatin for 1 h (dashed lines indicate the IC50 doses).
