
Figure 2.
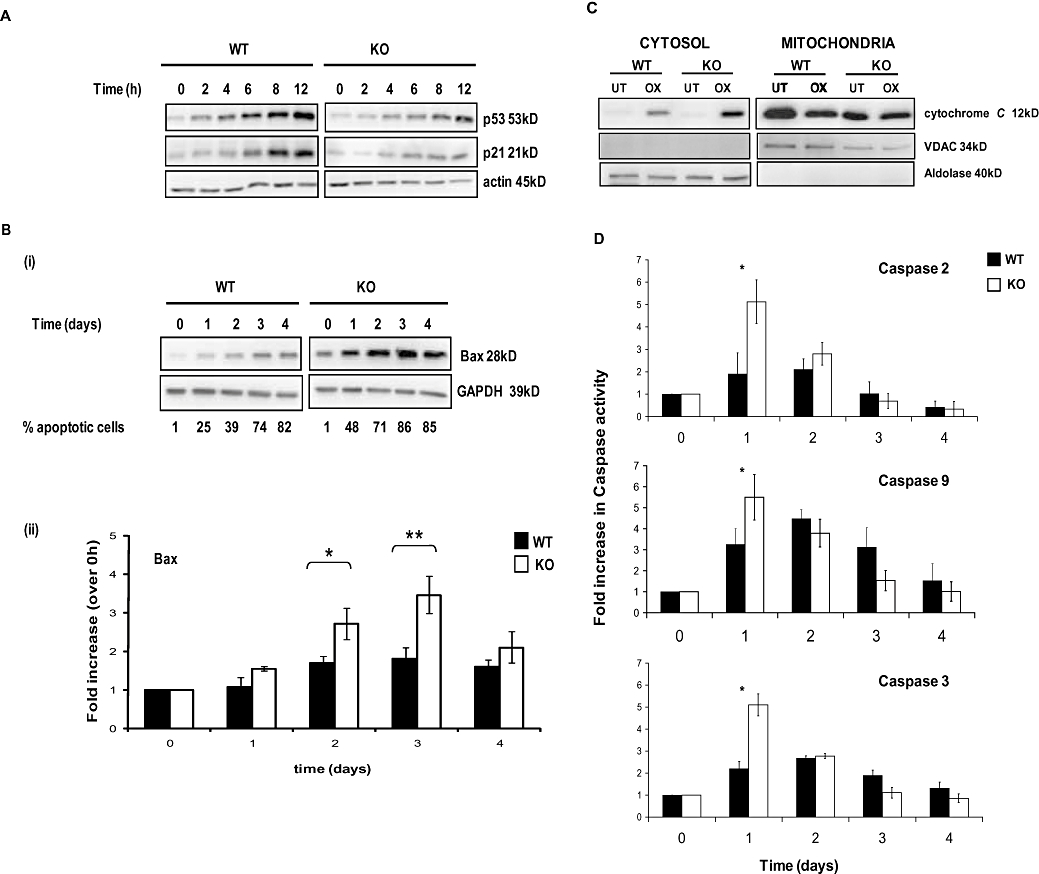
Kinetics of apoptosis of HCT116 wild-type (WT) and checkpoint kinase 2 (CHK2) KO cells induced by oxaliplatin. (A) Cells were continuously exposed to 40 µM oxaliplatin for up to 12 h. Western blots (50 µg protein per lane) show the kinetics of p53 stabilization and up-regulation of p21WAF-1. (B) (i) Western blots of HCT116 WT and CHK2 KO cells following continuous exposure to oxaliplatin for up to 4 days. (ii) Densitometry analysis of blots depicted in B (i). (C) Western blots showing cytochrome c levels in cytosolic and mitochondrial fractions from WT or CHK2 KO cells treated with 40 µM oxaliplatin (OX) for 2 days. GAPDH was used as a loading control. Validation of purity and loading were confirmed using VDAC for the mitochondrial fraction and aldolase for the cytosolic fraction. (D) Fluorogenic measurement of active caspase-2, 3 and 9 levels in HCT116 WT and CHK2 KO cells during a 4 day continuous challenge with 40 µM oxaliplatin. Blots are representative of three independent experiments. Actin was used as a loading control; error bars represent ±SE. *P < 0.05 and **P < 0.025, Student's t-test.