
Figure 6.
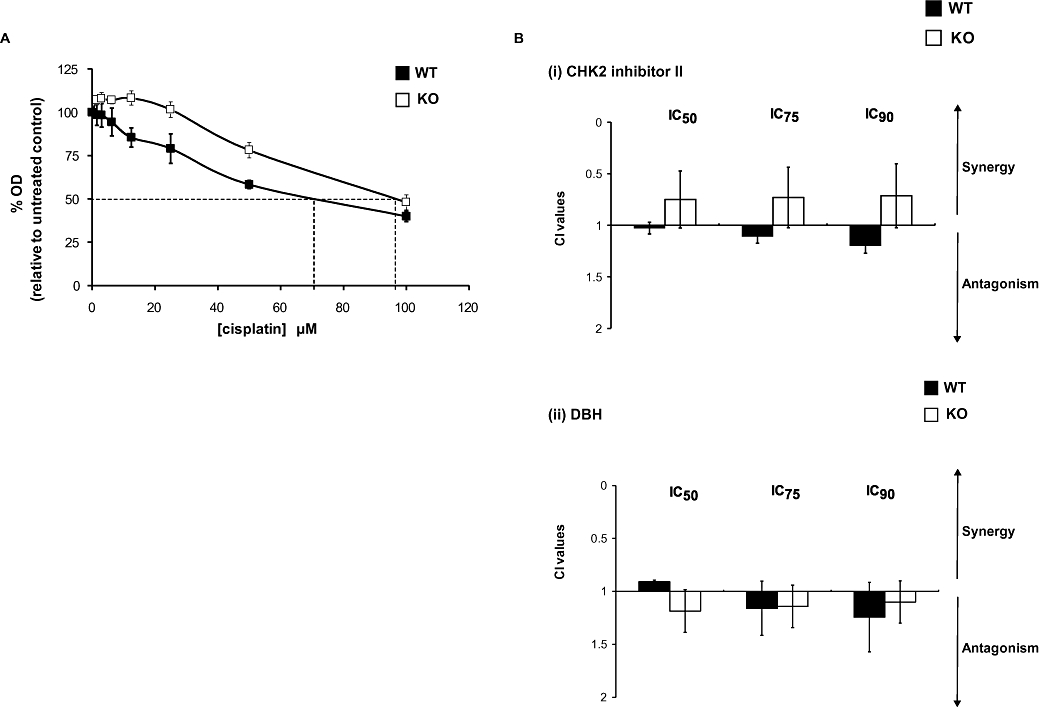
Effects of the checkpoint kinase 2 (CHK2) status of HCT116 cells on the response to cisplatin. (A) Response of HCT116 CHK2 WT and CHK2 KO following treatment with cisplatin for 1 h. Sulforhodamine-B (SRB) concentration–response curves, dashed lines indicate the IC50 doses. (B) Chou and Talalay combination index (CI) values following fixed drug concentration-ratios of cisplatin and either CHK2 II or debromohymenialdisine (DBH), as described in the legend of Figure 4.