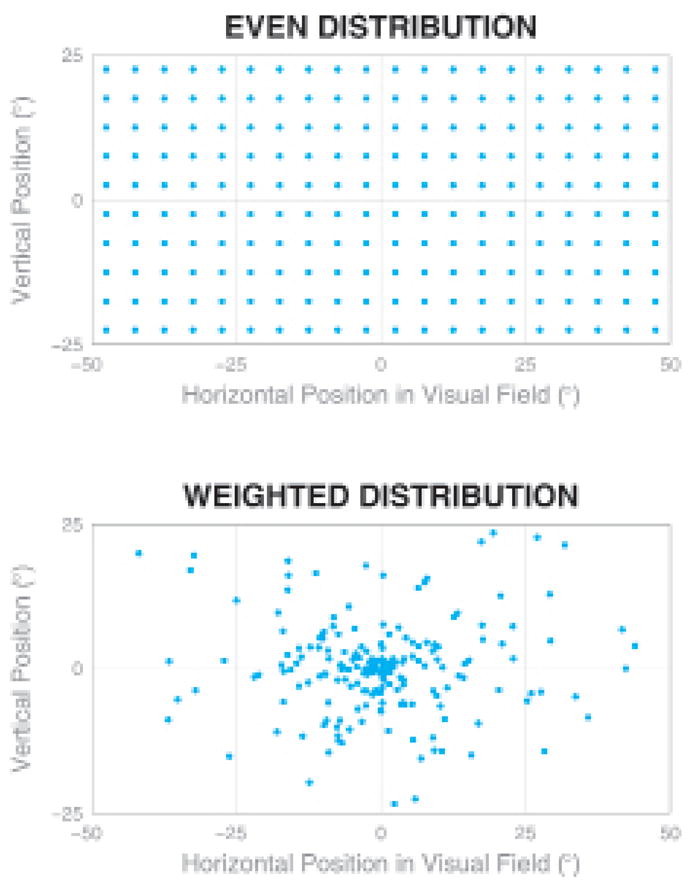
Fig. 3.

Charts showing simulated phosphene distribution patterns. Vertical and horizontal axes represent the positions along the visual field, and each dot represents a phosphene from an independent electrode contact. While there are equal numbers of contacts in the 2 diagrams, the lower pattern matches the intrinsic acuity profile of the primate visual system, and has a much higher focal acuity than the upper pattern. Upper: When prosthesis electrode contacts are placed on the retina in a regular pattern, the generated phosphenes also appear in a regular pattern across the visual field. Lower: When contacts are placed in a physically regular pattern in tissue downstream of the retina, the phosphenes will appear in a pattern strongly weighted to the center of the visual field.
