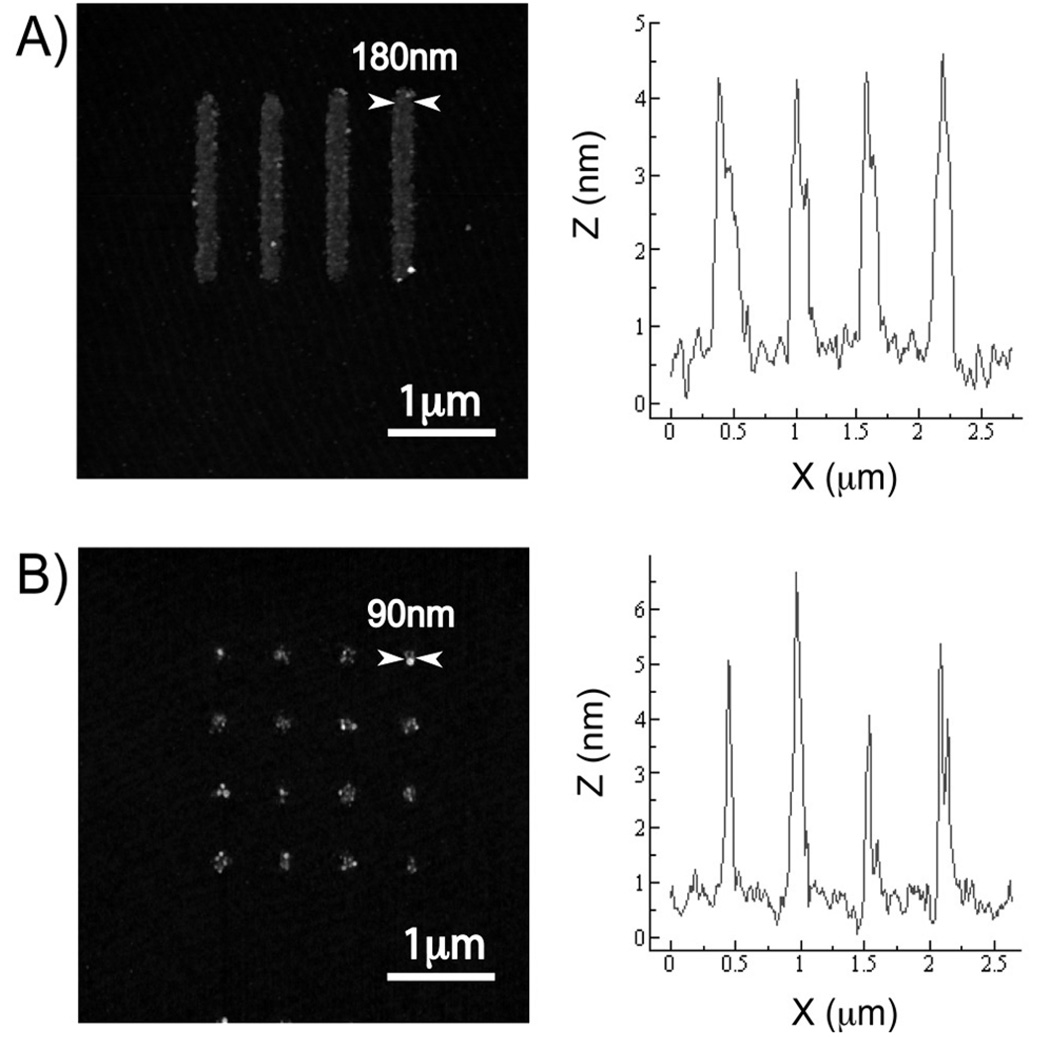
Figure 3.
AFM images and the cross-sectional profiles of patterned fibronectin nanoarrays – (a) 180nm lines and (b) 90nm spots. The fibronectin patterns were replicated with high fidelity from the parylene templates. The cross-sectional profiles were taken from a span across four array features on each image, and the FWHM of each peak was measured as the feature width. The heights of the patterned fibronectin features were relatively uniform at 4–5nm.

