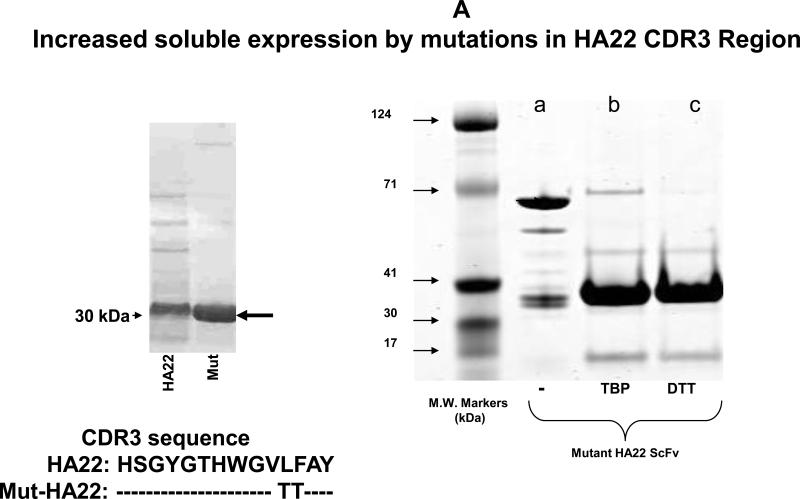
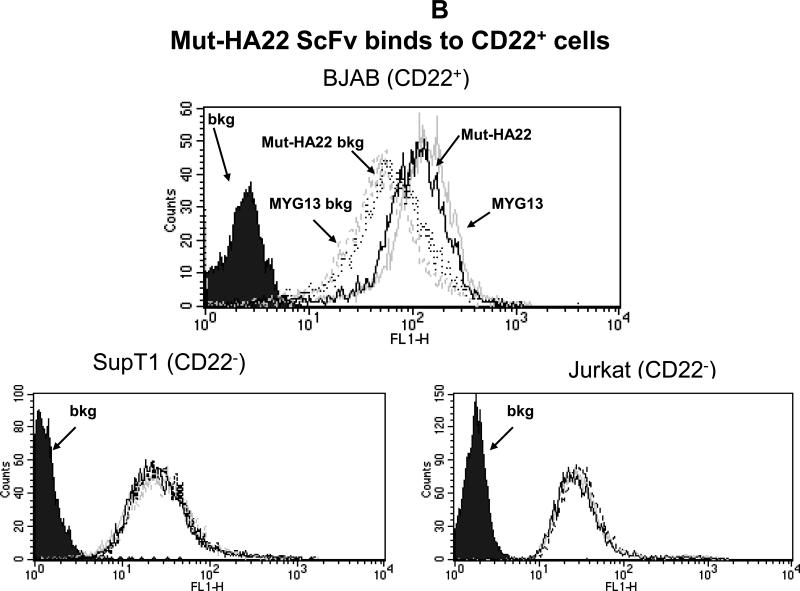
Figure 1. Characterization of mut-HA22.
Figure 1A: Analysis of mut-HA22. Mut-HA22 was analyzed by gel electrophoresis. (Left Panel), mutations to the CDR3 region of HA22 increased soluble expression of the scFv. (Right Panel), verification of mut-HA22 reduction by gel electrophoresis: (a) mut-HA22, shown as a monomer and dimer, (b) mut-HA22 reduced with tributylphosphine (TBP), and (c) mut-HA22 reduced with dithiothreitol (DTT).
Figure 1B: Mut-HA22 binds to CD22-expressing cells. To analyze specific binding of mut-HA22 with CD22, BJAB cells were incubated with 2μg mut-HA22 followed by sequential incubations with mouse anti-histidine IgG, and FITC-conjugated goat anti-mouse IgG. A commercial anti-CD22 IgG MYG13 was used as positive control, and was stained with FITC-conjugated goat anti-mouse IgG. SUP-T1 and Jurkat cells were used as negative controls. Graphs representing corresponding cell types are indicated. Fluorescence distributions of stained cells are: solid black curves, cells alone; black lines, immunostaining of mut-HA22; grey lines, immunostaining of MYG13; black dotted lines, mut-HA22's secondary Abs (mouse anti-his IgG and FITC conjugated goat anti-mouse IgG; dotted grey lines, MYG13's secondary Abs (FITC-conjugated goat anti-mouse IgG). These results were reproducible from at least three independent experiments. Bkg, background binding.


