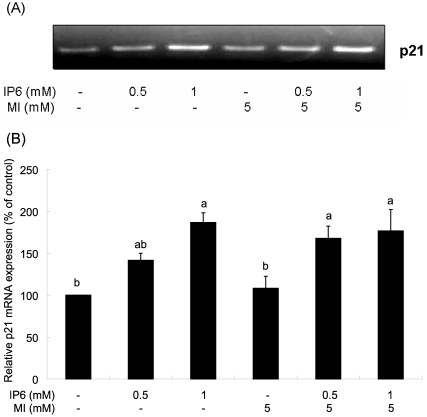
Fig. 3.
Effects of IP6 and MI on the p21 mRNA expression. Twenty-four hours after plating, cells were treated with IP6, MI, or IP6 plus MI at concentrations as described for 48 h. (A) Representative photographs of 3 independent experiments are shown. (B) The relative abundance of p21 was quantified with the control level set at 100%. Each bar represents mean ± SEM (n=3) and bars with different superscripts are significantly different at p<0.05.

