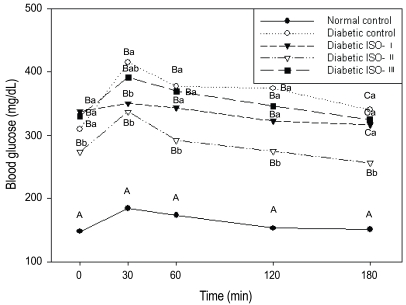
Fig. 1.
Blood glucose curves during OGTT in normal and diabetic rats.
At week 7 of the experimental period, the rats were administered with a glucose solution (0.1 g/100g B.W.) and the plasma glucose was determined at 0, 30, 60, 120, 180min after glucose load. Abbreviations: ISO: soybean isoflavone extract. Different capital letters at the same time point indicate significant differences (p<0.05) among the five groups and different small letters at the same time point indicate significant differences (p<0.05) among the four diabetic groups by Duncan's multiple comparison test.

