
Figure 1.
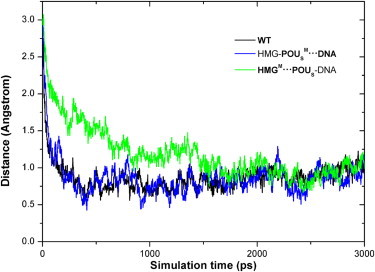
Distance of the POUS domain from its DNA-binding position in the NMR structure as a function of simulation time for the three model complexes during the association. The distance values were obtained by first calculating the distances between the center of mass of the POUS domain and that of the DNA-binding site, and then subtracting those distances by 18 Å, which is the mass centers' distance in the NMR structure. The black, blue, and green curves (color online) represent the WT complex, the HMG-POUSM···DNA mutant, and the HMGM···POUS-DNA mutant, respectively.