
Figure 2.
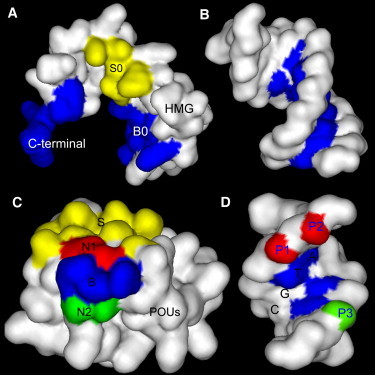
Protein-protein and protein-DNA binding surfaces in the HMG-POUS-DNA ternary complex. Panel A shows the binding surfaces of the HMG domain. The B0 and C-terminal regions (blue; color image is online) form base-specific contacts with its binding site CTTTGTC and bends the DNA. The S0 region (yellow) forms the protein-protein interface with the POUS domain. Panel B shows the corresponding DNA-binding site of the HMG domain for sequence-specific binding. Panel C shows the binding surfaces of the POUS domain. The S region (yellow) forms the protein-protein binding interface with the HMG domain. The B region (blue) consists of key amino acids and forms base-specific contacts with its DNA-binding site. Regions N1 (red) and N2 (green) consist of non-key amino acids and interact with the phosphate groups of DNA. Panel D shows the DNA-binding surfaces for the B, N1, and N2 regions of POUS using matching colors. The specific sequence ATGC that the B region recognizes is labeled. The phosphate groups P1 and P2 (red) forms at least four hydrogen bonds with the N1 region of the POUS domain. Phosphate group P3 (green) forms at least two hydrogen bonds with the N2 region of the POUS domain. This image was rendered by Discovery Studio Visualizer 1.7, Accelrys Inc. (http://accelrys.com/products/discovery-studio/visualization/discovery-studio-visualizer.html).