
Figure 4.
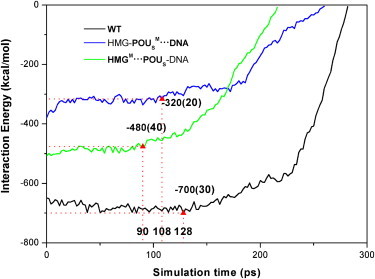
Interaction energy Eint(POUS·HMG-DNA, t) between the POUS domain and the HMG-DNA complex as a function of simulation time during dissociation for three model complexes. The triangles mark the interaction energies at the point of the initial dissociation of the POUS domain from the HMG-DNA binary complex. The error bars of the energy values are listed in parentheses. The numbers marked at the X axis represent the corresponding simulation times. The legend of the curves is the same as in Fig. 1.