
Figure 2.
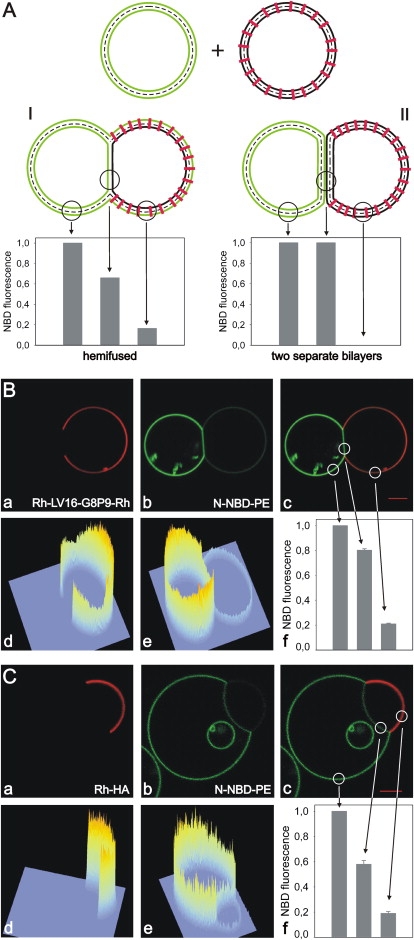
Fluorescence intensity of fluorescent lipid analogs in the contact region. (A) Expected fluorescence intensity of N-NBD-PE in membranes of adherent GUVs (left GUV labeled with N-NBD-PE (green); right GUV with inserted peptide (red)). Intensity is shown for two possible different structures of the adhesion region: (I) HD; (II) two separate adherent bilayers. Although no N-NBD-PE is found in the peptide-containing GUV for II, the outer leaflet of the peptide-containing GUV becomes labeled by the lipid analog for I. However, NBD intensity is reduced by ∼50% due to FRET from NBD to Rh-labeled peptides. (B and C) GUVs containing the peptide Rh-LV16-G8P9-Rh (B) or Rh-HA (C) and N-NBD-PE labeled GUVs were mixed. A total of 2 mM Ca2+ or Mg2+ were added to trigger adhesion of GUVs. Distribution of (a) Rh-labeled peptide; (b) distribution of N-NBD-PE; (c) overlay of a and b. Fluorescence intensity profiles of (d) rhodamine and (e) NBD. N-NBD-PE fluorescence intensity in three different bilayer regions is given in (f). Region of the NBD-labeled GUV outside the HD (intensity was set to 100%), HD, and region of the peptide-containing GUV outside the HD. Differences between B and C with respect to the relative intensities are due to the different sizes of GUVs.