
Figure 5.
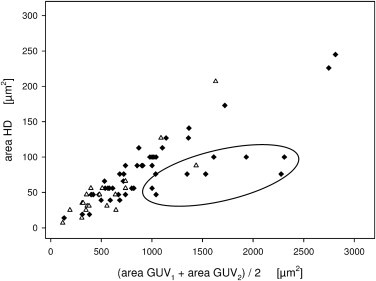
HD area versus GUV surface area. HD area plotted against the mean surface area of the two hemifused GUVs. (Solid symbols) GUVs containing 20 mol % PS lipids. (Open symbols) GUVs with 10 mol % PS. A shallower dependence was observed in case the size of the two hemifused GUVs was very different (encircled, ratio of GUV diameters >4).