
Figure 2.
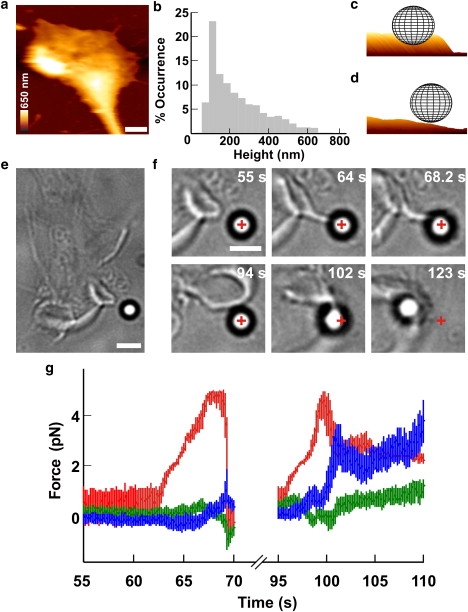
Push and retraction by a lamellipodium. (a) AFM image of a lamellipodium. The height is coded as in the colored scale bar and horizontal white scale bar, 2 μm. (b) Occurrence histogram of measured height of lamellipodium leading edges from seven growth cones. (c and d) Three-dimensional representations of a 1-μm bead in front of a thick (c) and a thin (d) lamellipodium. (e) Low-resolution image of a lamellipodium in front of a bead trapped with an infrared laser. Scale bar, 2 μm. (f) Successive frames showing the lamellipodium (55 s) growing toward the bead (64 s) and lifting it up (68.2 s). Subsequently, the lamellipodium retracted (94 s) and grew under the bead pulling it out of the trap during retraction (102–123 s). The cross indicates the center of the optical trap. Scale bar, 2 μm. (g) The three components Fx (blue), Fy (green), and Fz (red) of the force when the lamellipodium pushed the bead vertically (55–70 s) and when the lamellipodium lifted up and retracted (95–110 s).