
Figure 3.
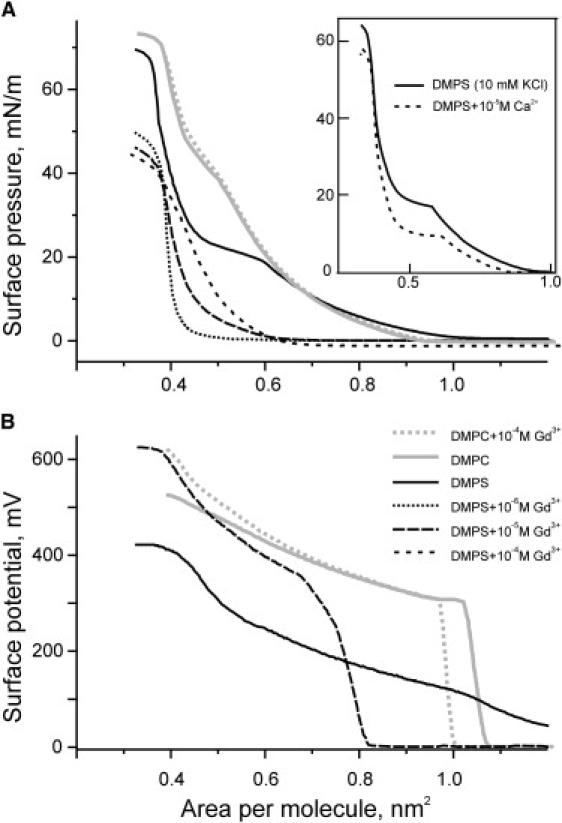
Effects of Gd3+ on the compressibility (A) and surface potential (B) of monolayers made of DMPS and DMPC. In B, surface potential traces are shown only for control and 10−5 M Gd3+, the latter essentially coincided with curves for 10−6 and 10−4 Gd3+. In all measurements the subphase electrolyte contained 10 mM KCl, 1 mM 2-(N-morpholino)ethanesulfonic acid buffer, pH 7.0. Coding of the traces is given in B. The inset in A represents the effect of 10 μM Ca2+ on the DMPS monolayer in the same background electrolyte.