
Figure 2.
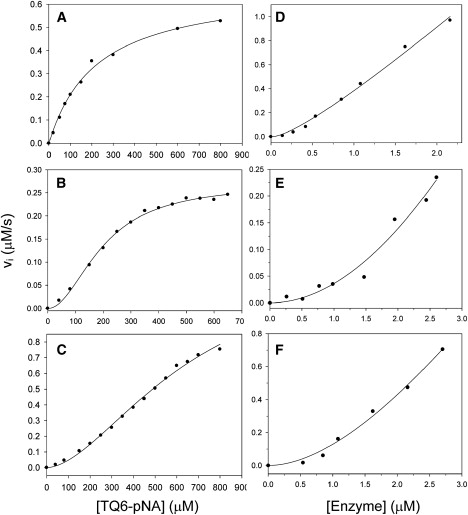
Initial velocity patterns of Mpro (A–C) and dependence of the initial velocity of Mpro on enzyme concentration (D–F). (A–C) Plots of the velocity difference at various substrate concentrations for wild-type, R298A, and R298L mutants, respectively. The lines represent results fitted according to the Michaelis-Menten equation (Eq. 1) for wild-type and the Hill equation (Eq. 2) for mutants. The kinetic parameters are shown in Table 1. (D–F) Difference in velocity at various enzyme concentrations for wild-type, R298A, and R298L mutants, respectively. The concentration of substrate was 600 μM. The line represents the best fit to the nonlinear dependence equation (Eq. 3).