
Figure 4.
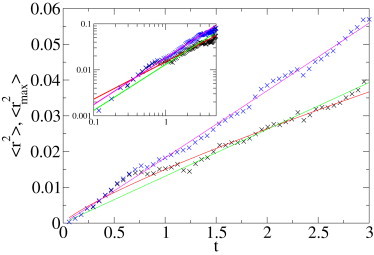
Analysis of an experimental set of 67 trajectories, the longest consisting of 210 points, for quantum dots freely diffusing in a solvent. MSD (black ×), fitted by a power law with exponents α = 0.81 (red line). We also show a fit with fixed exponent α = 1 (green line, expected behavior for BM). MME (blue ×), fitted by a power law (red line, α = 1.02). Time is in s; distances are in μm2. (Inset) Double-logarithmic plot of the same data.