
Figure 5.
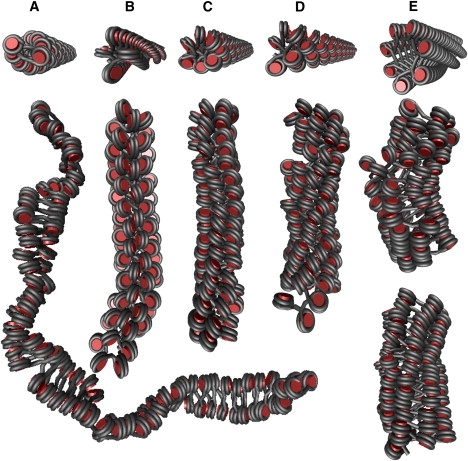
New structures for the CL and ID geometries derived from the numerical phase diagrams. The first row shows the initial structures as created in the static phase diagrams. The second row depicts sample fibers of the Boltzmann ensemble generated by extended MC simulations. The detailed properties of each structure are presented in Table 1. (A) CL geometry with 169 bp led to a [2, 1] fiber (ψ = 25°, β = 175°) with a mean diameter of 27.8 nm and a mean linear mass density of 2.9 nucleosomes/11 nm fiber. (B) ID fibers for NRL = 187 bp (ψ = 117.5°, β = 295°) with nucleosomes parallel to the chromatin fiber axis. The structure exhibits an open top-on-top stacking of nucleosomes with an average diameter of ∼31 nm and mean linear mass density of 7.1 nucleosomes/11 nm fiber. (C) ID fibers for NRL = 187 bp (ψ = 125°, β = 355°) with nucleosomes nearly perpendicular to the chromatin fiber axis exhibits a [6, 1] fiber conformation. Average diameter and mass density were similar to the structure depicted in panel B. (D) ID fiber with NRL = 197 bp (ψ = 130°, β = 355°) yielded a [6, 1] fiber conformation with a mean diameter of 35.9 nm and a mean linear mass density of 8.1 nucleosomes/11 nm fiber. (E) ID fibers with NRL = 207 bp (ψ = 133°, β = 23°). The second and third rows show examples of a fiber simulated with Emax of 9 and 12 kBT, respectively. For 9 kBT, [7, 1], [8, 1], and [9, 1] fiber conformations (in part mixed within the chain) occurred, whereas for 12 kBT more regular [7, 1] and [8, 1] fiber conformations appeared. Both structures had a mean diameter of ∼45 nm and linear mass densities of 9.9 (9 kBT) and 12.8 nucleosomes/11 nm fiber (12 kBT).