
Figure 2.
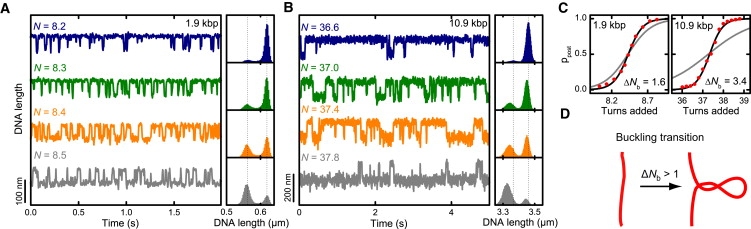
Equilibrium occupancy of pre- and postbuckling state. (A) 1.9 kbp and (B) 10.9 kbp DNA molecules were held at a constant force of 3.0 pN in buffer containing 320 mM Na+. Time traces were recorded at different amounts of added turns N in the vicinity of the buckling transition. Data were taken at 300 Hz. Normalized length histograms are shown on the right. The DNA was observed to rapidly fluctuate between two distinct states, the pre- and the postbuckling state. Dotted lines are centered on the peaks of the uppermost histogram and indicate the shift of the states throughout the transition. (C) Occupancy of the postbuckling state as function of added turns for both DNA lengths (red dots). Experimental conditions are as in panel A. Solid lines are fits to the data according to Eq. 5, where ΔNb was taken to be free (black line, ΔNb of best fit shown in graph) or fixed to ΔNb = 1 (gray). (D) Illustration representing the behavior of DNA at the buckling transition, which can involve the formation of a structure comprising >1 turn of writhe.