
Figure 3.
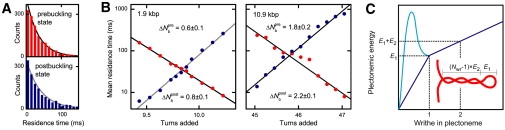
Kinetics of the buckling transition. Data shown is for 4.0 pN and 320 mM Na+. (A) Distributions of the residence times for the pre- and postbuckling state close to the buckling equilibrium (9.8 turns) for the 1.9 kbp DNA molecule. The solid lines represent a single exponential function with the mean residence time as characteristic decay time. (B) Mean residence times of the prebuckling (red solid circles) and the postbuckling states (blue solid circles) as function of added turns for the 1.9 kbp and 10.9 kbp DNA molecule. Solid lines are exponential fits to the data according to Eq. 7. The resulting distances to the transition state and are given in the figure. (C) Schematic drawing of the hypothetical energy landscape for plectoneme formation. Independent of the actual landscape for the initial loop (dark blue straight line and light blue line with transition state), the supercoiling energy attains E1 after one turn and increases with E2 for each subsequent turn. (Inset) Illustration of the plectoneme formation energies E1 and E2.