
Figure 4.
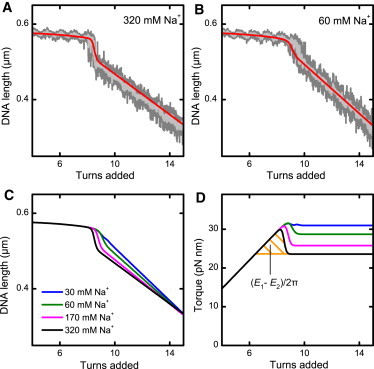
Measured supercoiling curves and predictions from the initial-loop model. (A and B) Supercoiling curves for a 1.9 kbp DNA molecule at 3.0 pN in a buffer containing 320 mM and 60 mM Na+ (as indicated). Data were taken at 300 Hz (dark shading) and smoothed to 20 Hz (light shading). The solid red line is the prediction from the initial-loop model according to Eq. 15 using estimates for the plectoneme formation energies E1 and E2 (Eqs. 16 and 17). (C) Salt dependence of supercoiling curves and (D) torque development as predicted by the initial-loop model. The shaded area between the torque overshoot and the postbuckling torque under the black curve corresponds to the difference between the initial loop energy E1 and superhelix formation energy E2.