
Figure 6.
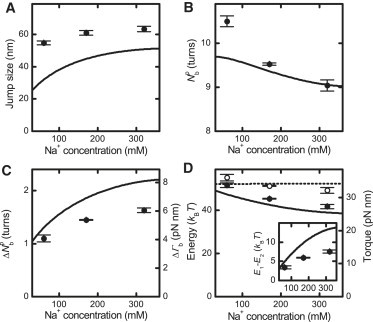
Salt dependence of the buckling transition parameters at 3.5 pN for the 1.9 kbp DNA molecule. Experimental values are shown as circles. Predictions from the initial-loop model are shown as black lines. (A) Jump size at buckling equilibrium. (B) Position of the buckling equilibrium. (C) Change of twist transferred into writhe during buckling at the buckling equilibrium and corresponding torque change ΔΓb. (D) Superhelix-formation energy E2, inferred postbuckling torque (solid circles and solid line), and initial-loop formation energy E1 (open circles and dashed line). (Inset) Energy difference between E1 and E2.