
Figure 7.
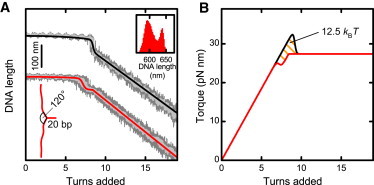
(A) Supercoiling curves for a kinked (lower) and a straight, i.e., unkinked (upper) DNA molecule taken at 3.5 pN and 320 mM Na+. Data are acquired at 300 Hz (dark shaded lines) and filtered to 20 Hz (light shaded lines). Solid red and black lines are calculated according to Eq. 15 with the initial-loop length reduction ΔL1, the initial-loop energy E1, and the superhelix energy E2 taken from fits to the data. The illustration shows the structure of the DNA kink. A 20-bp hairpin was introduced into the substrate, leading to the formation of a small three-arm junction. Neighboring arms should join at an angle of ∼120°. (Inset) Histogram of the DNA length at 7.0 turns for the kinked molecule. (B) Torque development for both molecules as predicted by the model. The shaded area enclosed by the two curves corresponds to the total difference between the initial-loop energies E1 for the straight and the kinked DNA molecule.