
Figure 1.
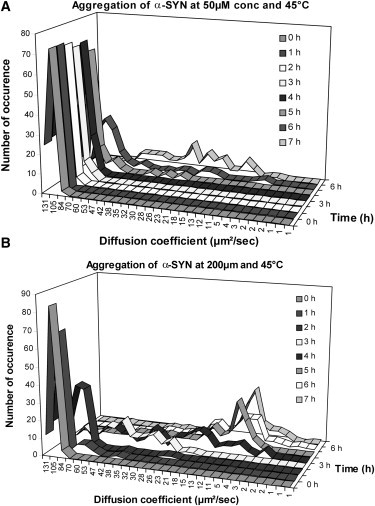
Concentration-dependent early oligomer formation of α-synuclein. Autocorrelation curves were obtained from repeated (100) measurements with short sampling time (10 s), using A140C-synuclein labeled with Alexa-488 as fluorescent probe in trace amount (3–4 nM) with excess unlabeled α-synuclein. The distribution of the average diffusion coefficient at different concentration of total protein (A) 50 μM and (B) 200 μM was plotted, as a function of aggregation time (h).