
Figure 2.
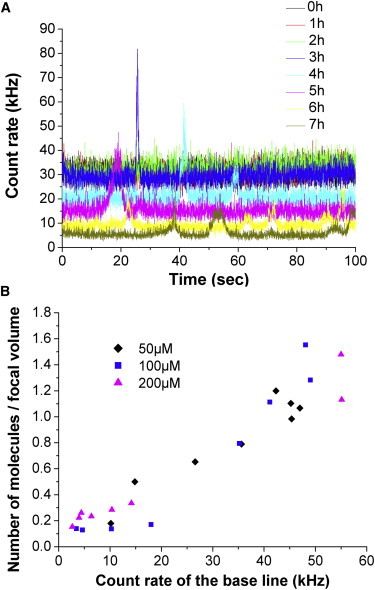
Decreasing count rate of fluorescence with oligomerization. (A) Gradual decrease of the count rate of the base line, with formation of big aggregates (spikes) with increasing time of aggregation. (B) The number of molecules (y axis), as obtained from the amplitude of the FCS curves, correlates nicely with the average intensity (count rate) of the fluctuating signal between the spikes.