
Figure 3.
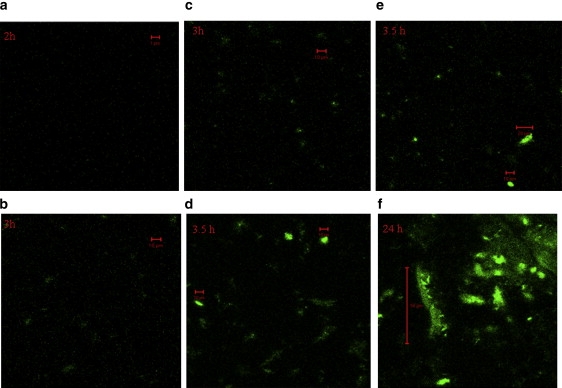
Visualization of aggregates by laser-scanning microscopy. Images were taken after each hour of aggregation of α-synuclein at 45°C with a concentration of 100 μM. (a) After 2 h of aggregation when the diffusion coefficient still corresponds to a monomer, no big aggregates are visible on the glass slide. (b) After 3 h, when FCS measurements show a transient intermediate corresponding to an average diffusion coefficient of 78 ± 15 μm2/s, a few big aggregates are seen in solution (100 μm above the glass slide) or (c) as precipitates on the bottom of the glass slide. (d) After 3.5 h, large (10 μm) aggregates are observed in solution and (e) as precipitates (10–20 μm) on the bottom of the glass slide. (f) After 24 h of aggregation, big aggregates of lengths >100 μm are precipitated on the glass slide.